If you read everything that’s been written about local search, you’ll know a lot.
Easier said than done. There’s a ton to read because there’s even more to know. It can be overwhelming.
It never stops being overwhelming. The longer I do local SEO, the more questions I have. For me, the questions reproduce like rabbits.
Still, every now and then someone picks up the crayons and communicates volumes in just a few square inches. Local-search enthusiasts do this better than most people who attempt to make infographics (most of which are confusing and useless).
Here are my favorite infographics and other visuals on local SEO. Except for the top 3, I haven’t listed them in any particular order.
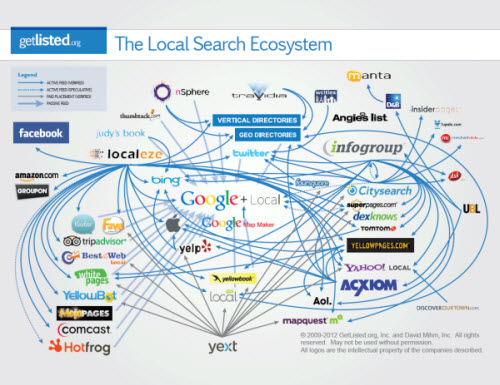
The Local Search Ecosystem – David Mihm
(accompanying blog post here and more info here)
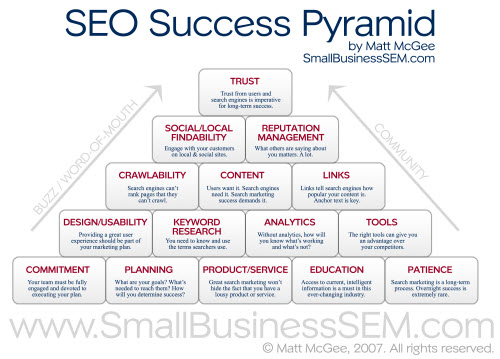
SEO Success Pyramid – Matt McGee
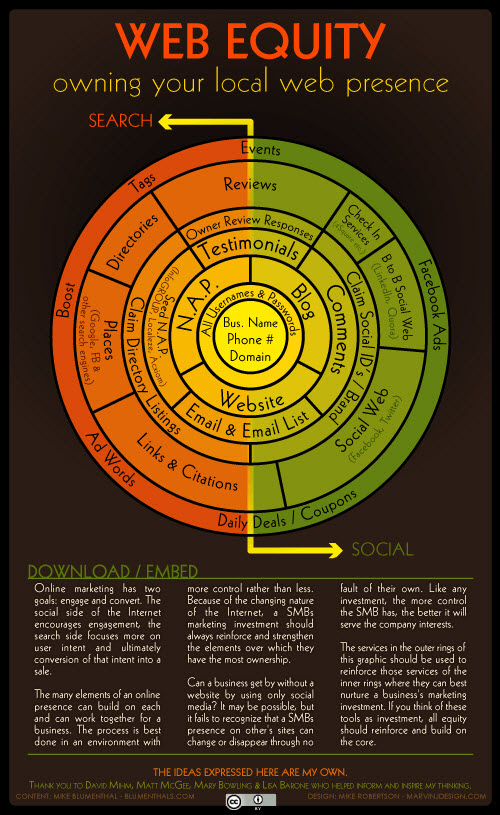
Web Equity: Owning Your Web Presence – Mike Blumenthal
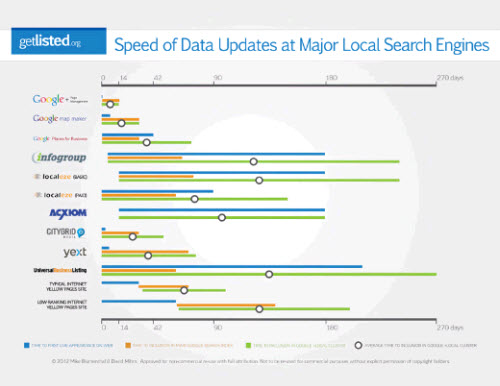
Infographic: Citations – Time To Live – Mike Blumenthal and David Mihm
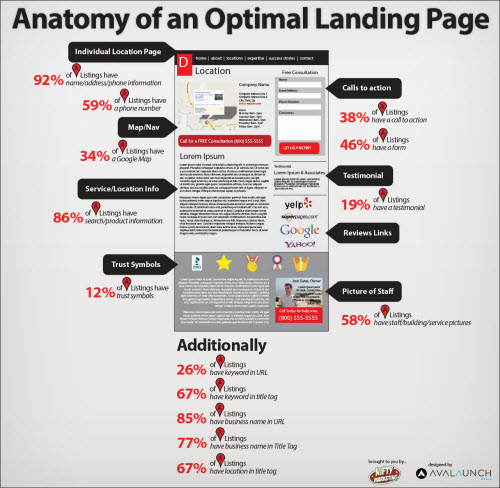
Anatomy of an Optimal Local Landing Page – Mike Ramsey and Avalaunch Media
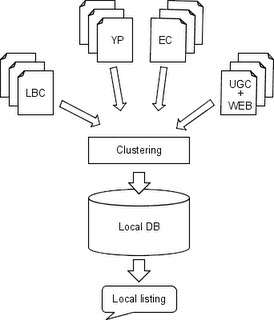
Google Details Information Sources for the Business Listing “Cluster” – Mike Blumenthal
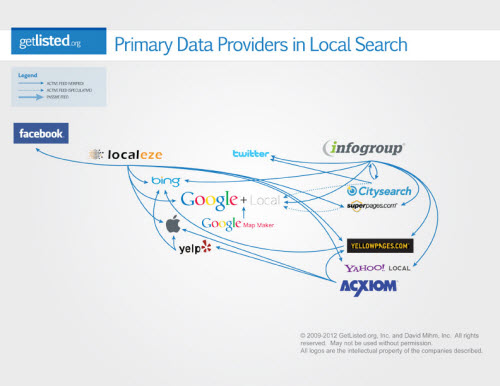
Primary Data Providers in Local Search – David Mihm via GetListed.org
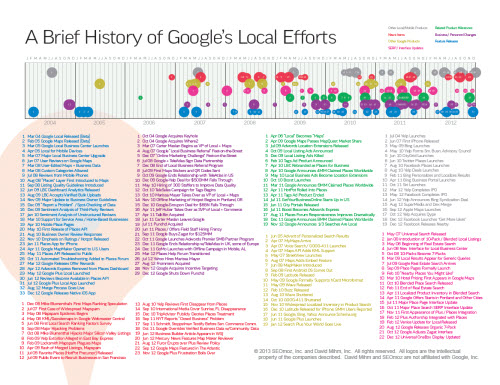
A Brief History of Google’s Local Efforts – David Mihm
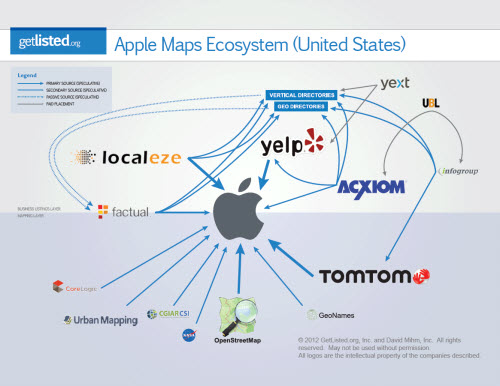
The Apple Maps Ecosystem – David Mihm
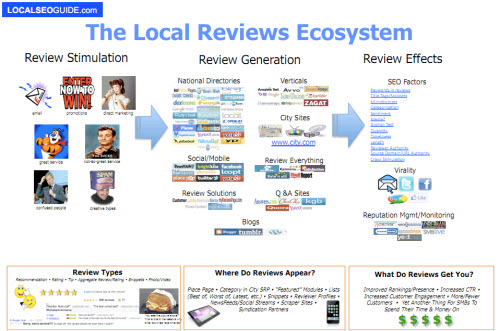
The Local Reviews Ecosystem – Andrew Shotland
(Note: Although I’d seen Andrew’s graphic long before I published my similarly-named “ecosystem,” I forgot the name of the former by the time it came time to name the latter. Major head-smack moment!)
—
I won’t put my own infographics on the same list as the great ones above, but here they are anyway, bringing up the caboose:
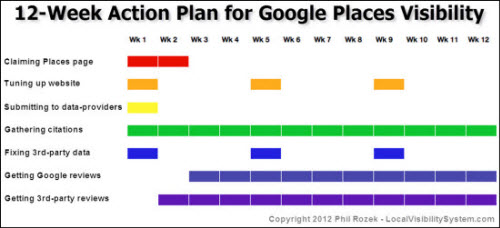
12-Week Action Plan for Google Places Visibility
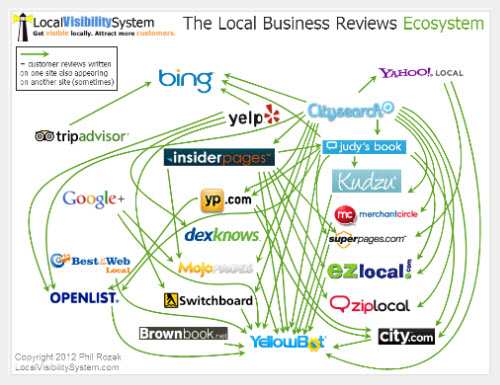
The Local Business Reviews Ecosystem
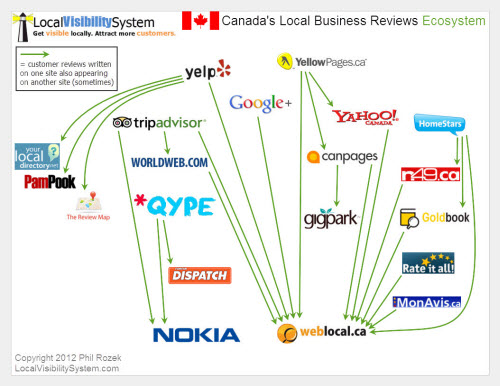
Canada’s Local Business Reviews Ecosystem
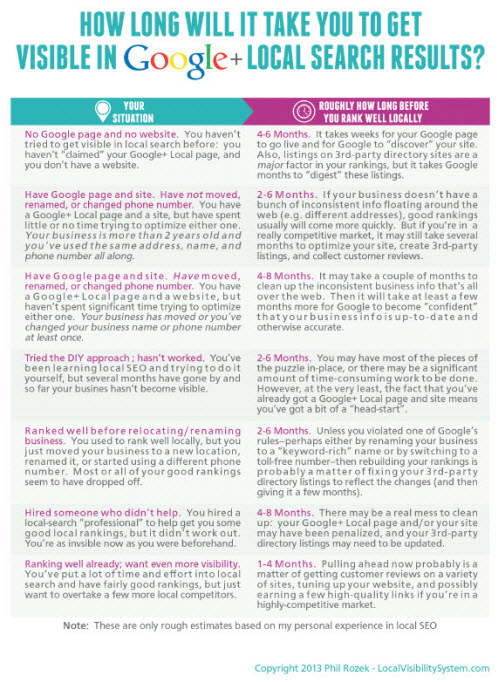
How Long Local SEO Takes: the Short Version
—
Can you think of any handy graphics I missed? Let me know – leave a comment!
