It’s hard enough to pilot your business into Google’s local search results and pick up the right customers. That’s even harder if your instruments point you in the wrong direction, or you look at them wrong, or you look at the wrong instruments.
In local SEO it’s easy to waste precious time and energy on goals that don’t matter, problems that don’t exist, or showy numbers that obscure important numbers. The end result is you waste time and work less on what affects your business the most, and generally achieve the opposite of what you want.
I spend a lot of time with clients (long-term, audit, and consultation) homing in on one thing and tuning out another thing. Below is a rundown of what I’ve found to be most common goofy and unimportant measurements of success or trouble in your local visibility effort. I also explain the benchmarks I suggest paying attention to instead.
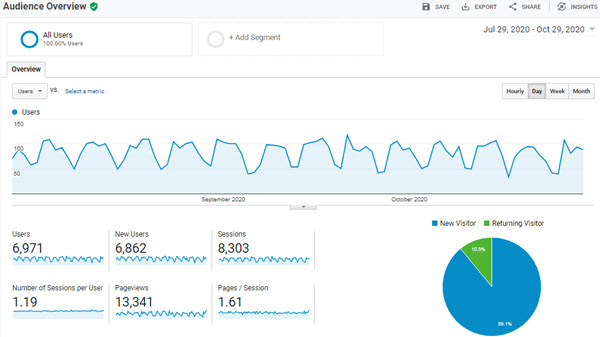
Goofy metric #1: total traffic to site.
That is, total traffic as measured by Google Analytics or whatever third-party tool you might use. Doesn’t matter if we’re talking about unique + return visitors, or only uniques. Two basic problems with this metric:
1. Total traffic doesn’t tell you how much of your traffic goes to pages that don’t help you get customers. Let’s say you have a blog post or page with legs – one that brought you 30% of your monthly traffic until now. It’s a good resource, but its visibility never seemed to correspond to an uptick in business. It may be that your “money” pages – the kind that local customers find in the local results and act on – still do just fine.
2. Total traffic doesn’t tell you how visible your business is. It only tells you how many people trickle through Google and onto your site (or who go directly to your site, without ever hitting Google). Keep in mind Google’s ongoing effort to keep searchers on the search results and, by extension, away from your site.
So your traffic can appear totally normal (whatever “normal” is for your business) even though your search visibility has tanked, or your visibility can still be great even though your traffic looks like it’s shriveled.
Better metric: total # of impressions, according to Google Search Console. For your whole site, for a specific page, for a specific query, etc. The number of impressions will tell you how many people actually SEE a page (or a whole site) in the search results, whether or not they end up clicking. (The fact that Search Console shows you impressions, whereas Google Analytics does not, is one big reason I tend to pay more attention to Search Console, especially for troubleshooting.)
Getting more people to click on low-click-through pages is a challenge you can work on. The same is true if you see a page that’s getting fewer clicks AND fewer impressions: In that case you can easily figure out when that trend began, whether only that page is affected, and for which search terms it’s sagging (see the “Queries” tab).
You’ll probably want to zero in on your visibility (total impressions) for search terms you’re trying to rank for, rather than for brand-name search terms. Impressions from people who search for your business by name don’t tell you much about your overall visibility in local search. Brand-name visibility is kind of a given – a baseline.
Of course, it’s still smart to pay some attention to total traffic, because that can alert you to the more-specific problems you’ll want or need to identify. Just don’t fixate on it, because it never tells the whole story or helps you figure out what to do about it.
Goofy metric #2: “average position” in Google Search Console and in certain rank-trackers.
The reason is simple: in Search Console the “average position” not localized. So it might say a certain page on your site ranks #117 for “Pittsburgh plumber,” even though that page ranks #4 in the organic results that people in Pittsburgh see when they type in “plumber,” and maybe you also rank #2 there in the Google Maps 3-pack for the same term. Search Console wouldn’t tell you those two facts, nor would many “local” rank-tracking tools (I’d rather not name names).
Again, that’s a problem just because your instruments would tell you you’ve got a problem when you may in fact be OK. That could lead you (or an easily-frightened SEO person) to mess things up by changing stuff that not only doesn’t need changing, but that also helps you get whatever visibility you’ve got.
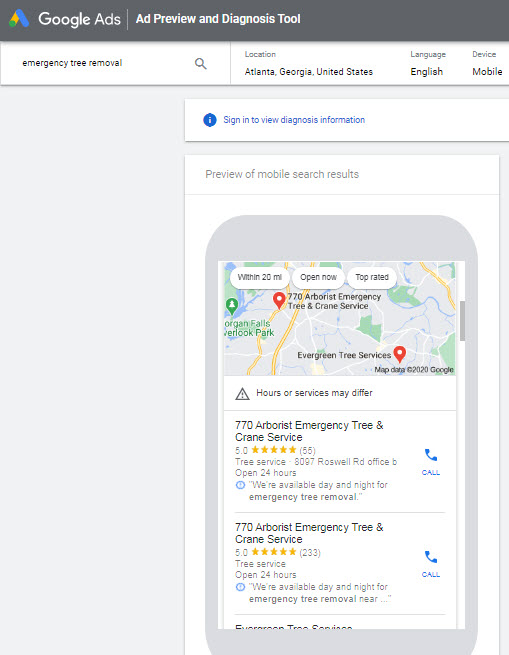
Better metric: either impressions in Search Console (as I described a minute ago) or the rankings you see in the Anonymous Ad Preview & Diagnosis Tool, or both. The latter is great because you can set a default search location and see exactly where Google sticks you. The only problem is it only shows the first page of search results, so it won’t tell you whether you rank 49 or 50 for a certain term. But it will show you where you show up in the 3-pack and when you’re anywhere on page 1, which typically are the factoids you really want to know.
Goofy metric #3: how many terms you’re #1 for.
As in #1 in the Google Maps 3-pack, or in the organic results, or either or both. In at least one sense “#1” translates to less visibility than it used to, because of where Google Ads (and sometimes Local Services Ads) have been stuffed, and how those ads have increasingly pushed down. The other issue is how we’re so used to seeing all kinds of crap rank #1. We rely on Google more to tell us what our options are than what options are good.
Better metric: how many terms you rank for where you’re the obvious choice to click on. When everything else is equal, of course it’s best you’re #1. But if you’re #2 on the map, and you’ve got the most Google reviews, and you’ve got the highest average rating, and the #1 result is lame, then you’re still in the catbird seat. Likewise if you’re #3 in the organic results but have the most-compelling title + description, or best business name, or maybe another organic result or some Google Maps rankings or a great PPC ad on the same page that act as your backup dancers. You’ll get more business from being the best result on a page, rather than only the highest.
Goofy metric #4: number of links to your site.
You can go buy thousands of links right now and tell me how much it helps your rankings. I expect you’ll find those don’t help much. (Possibly a little bit, but then you risk an algorithmic or manual penalty sooner or later.) You’ll still be outranked by the same annoying competitors, both in the 3-pack and in the organic results. one less-risky way to see what I mean is to use your backlinks checker of choice (I like Ahrefs) to check on 6 local businesses that rank for a term you consider a priority: How many links the 3 highest-ranking businesses have, and how many links do the next 3 (#4-6) have? Does each of the top 3 have more links than each of the next 3? You’ll probably find that the link count varies – a lot.
Better metric: the number of relevant links to your site, particularly to specific pages you consider high priorities. When I a link is “relevant” I mean it’s from a site that is geared toward your industry, geared toward your city or region, or both. In my experience the relevance of a link matters more than anything else.
Goofy metric #5: number of reviews.
What if you have the most reviews, but your average rating is 2.9 stars? Or you have a good average rating, but the positive reviews are so terse they look forced or fake? Or all the reviews are old?
Better metric: for how many local search terms is your business the obvious choice to click on, in terms of review count AND average rating?
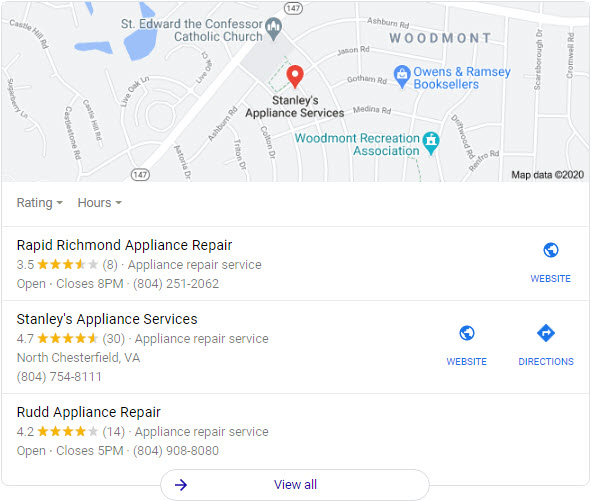
I’m talking about both the Google Maps / 3-pack results and the search results within review sites, like Yelp, Zillow, Houzz, HealthGrades, Avvo, TripAdvisor, etc. In cases where it’s hard to say whether the average searcher would click on your pile of reviews or on a competitor’s pile of reviews, it’ll probably be clear to you whether you need to work on your average rating, or your review count, or on something else.
Goofy metric #6: number of 5-star reviews.
This is a red herring for many reasons, but for one reason above all: often the 5-star reviews aren’t impressive or persuasive. Searchers click on the list of reviews and read some of them, and often the reviewers don’t go into much detail as to why they picked and liked a business.
Better metric: number of super-reviewers: people who reviewed you on multiple sites, people who wrote almost a sales-letter-length review and included pictures, people who got a spouse or family member or friend also to review you, people whose reviews you know for a fact drive business (because customers or even reviewers said so) , etc. I realize that’s a squishy definition, so it’s up to you to define who constitutes an online “cheerleader.” The point is you gain more by tracking and increasing the number of those people than by fixating on the number of 5-star reviews.
Goofy metric #7: Page speed according to Google PageSpeed Insights.
In general, a fast-loading site is great. But obsessing over it is not, because the fastest site isn’t necessarily the most visible or most profitable one. If page speed was a huge factor, you’d go whole-hog and just put some strategic words on a page and get mighty close to a 100/100. Some companies with pretty good SEO teams seem to recognize that page-speed is one goal of many, to be balanced with other goals, and that you don’t need perfect marks.
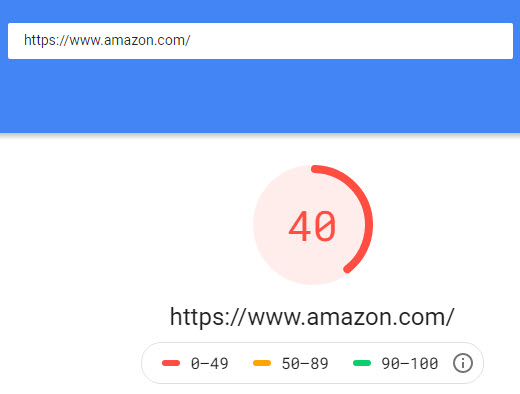
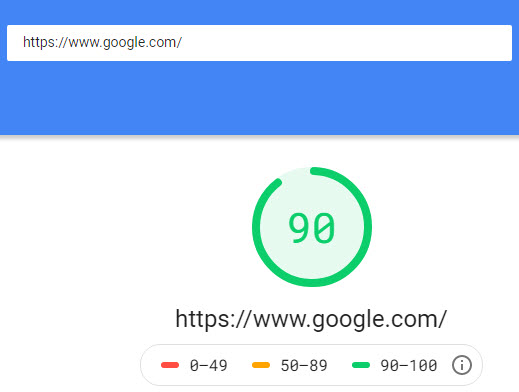
Better metric: how many formidable competitors’ sites is your site faster than? I’m talking about sites that outrank yours or that you know for a fact drive a lot of business, or both. Try to make your site more informative, more persuasive, easier to use, and faster than those sites, even if you’re nowhere near a perfect 100. If a bear is chasing you through the woods, you don’t need to outrun the bear – just the other campers.
By the way, here are a few too-commonly-heeded“metrics” I’d generally ignore:
- Domain Authority (Moz) or Domain Rating (Ahrefs) of your site
- Google My Business Insights’ “last 30 days” stats
- Moz Local “completeness” score
- Yoast “optimization” score
They have their place in the world, but they don’t tell you much about how your local SEO effort is going.
—
Can you think of other nutty local SEO metrics I didn’t mention?
Am I too harsh on a benchmark that you’ve found to be useful for diagnosis – and why is that?
What’s your single favorite (or least-favorite) indicator of triumph or trouble?
Leave a comment!

As always Phil, your nuggets are a must-read and particularly like the ads.google.com/aw/diagnostic/AdPreview
Can’t believe I haven’t been using that. Have relied on whatsmyserp to try and give me local results outside of my natural area which is giving different info. Seems I’m in danger of being that overzealous SEO and fixing whats wasn’t broken!
Thanks, Steve. Google did introduce the Anonymous Ad Preview Tool quietly – so quietly that I probably heard about it months after it rolled out. Until then I had used the one IN AdWords, which has been around forever, of course. The “anonymous” version is handier, of course.
This one is also good: https://valentin.app/
Thanks Phil. A sign of relief. You can go crazy looking at numbers and metrics. The bottom line is to do whatever it takes to get the phone ringing. Thanks so much for the insightful information. I always enjoy reading your material. Enlightening, informative and needed, to say the least.
Thanks a lot, Sherm.
Yes, it’s all about getting the phone to ring, but I’d also say there are layers of complexity: they need to be the right callers, they need to come in now and longer-term, ideally they find you through at least a couple of visibility channels (in case one tries up), and ideally those customers help you bring in others (via word-of-mouth, reviews, etc.). Like most people, I find that to be tricky.
We’re the mice and Google decides* what we do to get the cheese. (*At least for now.)
Most of this is great, but a little of it, Id politely suggest is maybe just a bit cute. Particularly in working with local businesses, having metrics that clearly say “you want to get as many high rating reviews as possible” seems intuitively very useful to me, and in my experience the obvious metrics (volume and avg rating) fit that bill very neatly, where some clients really do need to be walked up to the idea of being proactive with their review management/gathering/systems/etc. Of course in saying that I haven’t tested the suggested alternative approach, but again just intuitively the suggeted alternate metrics for these seem a little too qualitative rather than quantitative for my tastes (at least where using data to communicate with clients is concerned).
Hey Adam,
I agree that a couple of the benchmarks are squishier and more open to interpretation (like #3 and 6) than others, but most of these are complementary to the usual metrics. In the sense that it’s fine to measure and care about, for instance, total traffic (#1), total reviews (#5), and load time (#7), but if those are all you look at you’re more likely to be stumped when someone still outperforms you.
If only I had a nickel for every time someone’s said something like, “Phil, I’m #1 for all these terms but don’t get much traffic or many customers,” or “Why does my competitor with 2 reviews and 13 links outrank me?” or “Why is my fast-loading site outranked by this slowpoke site?”
#1-2 are quantitative. #4 and 7 are pretty quantitative. The others can be firm or squishy, just depending on your approach.
You may want to reread the post, because I go out of my way to say that those standard metrics aren’t bad, but rather just don’t reveal as much as one might think. Good reporting includes numbers, as you know, but some of the need-to-know facts simply don’t fit into a spreadsheet.
Really happy to have found the Google Ad preview tool! I wanted to share this post on social media using Buffer but none of the images resolved?
Thanks, Caz. I usually just tweet my posts without an image. Not because of the reason you cited, though there’s no shortage of clunkiness on my site 🙂
Thanks Phil
I agree with almost all of your insights here. The main problem we find (and I’m sure this would be the case for many SEO agencies), is that no matter how much we might tell our clients that ‘this’ or ‘that’ metric isn’t as important as it seems, many clients are happy if they see in monthly reports that they rank #1 for a query, or have an average 5 star rating rather than 4.5. We can tell them over and over that the Conversion rate and overall ROI is higher than last month, but sometimes the raw numbers (Rank #1 or 5 stars) are the holy grail for many SMEs.
This is certainly an issue of educating our clients, and also true that we need to be able to ‘track and trace’ the key metrics you are talking about so that the client is satisfied. Our industry is certainly a ‘work in progress’. Thanks as always for your thought provoking post.
cheers
Phillip
It is tricky indeed, Phillip. Clients sure do latch onto certain metrics. I’ve found that the door opens a crack when they look at those metrics and still can’t figure out why a certain problem is happening: a drop in traffic, a drop in rankings, a drop in customers, etc. Often that’s when these other metrics can prove useful.